28 Oct Using Heatmaps to Support Parents’ Consultations: A Teacher’s Guide

Challenge Mode in NumBots is designed to improve recall of key number facts, such as number bonds to 10 and adding single-digit numbers. It consists of 30 distinct, 60-second skill rounds, making it an excellent tool for quickly identifying students who are excelling or struggling with these foundational skills.
The heatmap data, drawn from Challenge Mode, provides a clear visual representation of each student’s progress, helping you better understand their strengths and challenges. Here’s how heatmaps can guide meaningful conversations during parents’ evenings.
What heatmaps show and where to find them
In Challenge Mode, students tackle key areas like addition, subtraction, and number bonds. As they progress, the heatmap visually records their performance: The addition and subtraction heatmaps display your students’ median answer speeds for each addition fact up to 10 + 10 and their subtraction inverses. This data-driven tool helps pinpoint where students are thriving and where they need extra support.
To view a student’s heatmap, simply click on the colourful heatmap icon next to their name in the Challenge Results table.
This detailed, color-coded display helps you quickly identify a student’s strong points and areas where they need additional support:
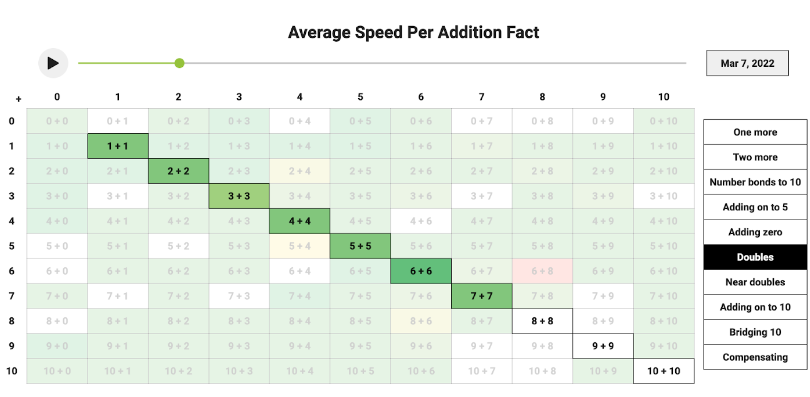
Red areas highlight challenges where mistakes occur frequently.
Green areas show topics where the student is consistently successful.
Why heatmaps are useful for parents’ consultations
When preparing for discussions with parents, heatmaps provide clear, easy-to-understand data that can guide the conversation. Here’s how they help:
Highlight mastery in key topics:
With green sections on the heatmap, you can show parents where their child has gained strong competence, giving them a concrete view of their child’s achievements in certain number skills.
Identify areas of difficulty:
You can provide targeted advice for home practice based on where a student is struggling. The red sections of the heatmap tells you exactly which topics need extra attention and can lead to a productive conversation about strategies for improvement, both in class and at home.
Track progress over time:
By looking at the heatmap over time, you can show parents how their child’s performance has evolved. This is especially useful for demonstrating improvement in response to interventions or explaining where further focus is needed.
Make the most out of heatmaps and turn those parent consultations into data driven conversations! For more information on interpreting NumBots data, visit the guide below: